
Long-term eu energy dependence on Russia and its transformation after 2022
Dorota JEGOROW  *
*
Piotr RUBAJ *
Abstract. This article examines the long-term evolution of the European Union’s dependence on Russian mineral fuels and its transformation after 2022. The analysis combines Eurostat trade data for 1999–2021 with complementary post-invasion evidence from European and international sources. Using structural comparisons and correlation-based diagnostics, the study identifies dominant fuel categories and differences in adjustment across Member States. The findings show that oil and gas created deep path dependencies that limited the speed of decoupling. Although direct imports fell sharply after 2022 and diversification accelerated, the process remains uneven and indirect exposure has not disappeared. The article contributes by linking historical trade structures with the emerging post-war regime and by distinguishing between transit roles and domestic energy policy. The results inform debates on EU energy security and the governance of diversification. The results indicate that diversification capacity is strongly conditioned by pre-existing infrastructure and trade geography.
Key words: energy security, EU energy policy, mineral fuel imports, Russia-EU trade relations, import dependence and diversification.
1. Introduction
Supply shocks in the market for energy raw materials following Russia’s invasion of Ukraine have reshaped the European political and economic debate. The discussion has become dominated by concerns over international trade, the continuity of strategic energy supplies and the broader implications for the functioning of EU Member States. Although the main suppliers of energy raw materials to the European Union have changed in recent years, Russia has long remained the dominant provider of all major fuel categories, particularly natural gas, crude oil, and coal. The disruption of these supplies after 2022, combined with unprecedented price increases, created serious economic, social, and political challenges across the EU.
Against this background, this article examines the scale and evolution of EU imports of mineral fuels, lubricants and related materials from Russia across individual EU Member States and fuel categories. The analysis focuses on the period 1999 to 2021, when detailed Eurostat data are available, and is supplemented with post-2022 figures from the European Commission, the International Energy Agency (IEA), and specialised research institutes in order to capture the rapid structural changes that followed the outbreak of the war.
The political direction of reducing fossil fuel dependence has been formally anchored in key EU strategic documents, most notably the European Green Deal and the REPowerEU plan adopted after the outbreak of the war. These frameworks combine climate objectives with urgent security-of-supply measures, explicitly calling for a rapid reduction of imports of Russian fossil fuels, diversification of suppliers and acceleration of renewable energy deployment (European Commission, 2019; European Commission, 2022).
In 2024, the total value of energy raw material imports to the EU amounted to EUR 375.9 billion, representing a decline of 16.2% compared with 2023. EU-Russia trade fell to approximately EUR 67.5 billion, with imports from Russia at EUR 35.9 billion, of which about 62% consisted of mineral fuels. The share of Russian gas in the EU demand dropped to roughly 12–13%, down from 40–48% before 2022, reflecting a profound shift driven by rising LNG imports and alternative seaborne deliveries (European Commission, 2024; Bruegel, 2024).
Data for 2022 to 2024 confirm a marked reduction in the EU’s dependence on Russian energy resources, driven primarily by increased LNG imports and the diversification of supply routes towards Norway, the United States, Qatar, and Azerbaijan. Nevertheless, several EU Member States have remained more vulnerable due to infrastructural and market constraints. Despite the decline in volumes, the EU still paid approximately EUR 21.9 billion for Russian fossil fuels in 2024, which has had important political and budgetary implications (CREA, 2025). At the same time, the role of Norway and the United States as principal suppliers of gas and oil has expanded significantly. According to the World Energy Outlook 2023, the United States has become the largest LNG supplier to Europe, while Norway’s share in pipeline gas deliveries reached record levels (IEA, 2023).
The transformation of European energy relations after 2022 has generated an intense academic and policy debate. Scholars emphasise the tension between market integration, infrastructure inertia and geopolitical risk, pointing to the difficulty of rapidly replacing historically embedded supply structures. Particular attention is paid to diversification capacity, institutional coordination and the uneven exposure of Member States.
Existing literature has extensively examined the EU’s dependence on Russian energy supplies, although most studies focus on the pre-2022 period or offer primarily qualitative assessments of post-invasion developments (Goldthau and Sitter, 2020; Mata Pérez et al., 2019; Rybak et al., 2022; Weiner et al., 2025). Quantitative, longitudinal research that systematically compares the structure and volume of imports across major fuel types and EU Member States before and after 2022 remains scarce (Ah-Voun et al., 2024; Czech and Wielechowski, 2023; Finley and Mikulska, 2023; Goldthau and Youngs, 2023; LaBelle, 2024; Sampedro et al., 2024; Spiro et al., 2025). This article addresses this gap by providing an empirical analysis of EU energy imports from Russia over the period 1999 to 2024 and by examining the uneven pace of the decoupling process.
The methodological approach used in this article is based on the analysis of Eurostat trade data and the comparison of import structures across EU Member States and fuel categories. The study identifies the largest importers of Russian energy resources, assesses long-term structural changes and evaluates the extent to which EU countries have been able to replace Russian supplies with alternative sources. The results aim to contribute to the ongoing scientific and policy debate on European energy security, diversification strategies, and the long-term implications of the geopolitical realignment triggered by Russia’s invasion of Ukraine.
The novelty of this study lies in three elements. First, it provides a long-term, harmonised dataset covering the period from 1999 to 2024, enabling comparison between the pre-war dependency regime, and the emerging post-2022 order. Second, it distinguishes between direct import reduction and the persistence of indirect channels through trade hubs and third countries. Third, it interprets statistical patterns through the lens of structural path dependence, showing why rapid political decisions do not automatically translate into immediate market outcomes.
2. Literature review
Energy policy in the 21st century has been shaped primarily by environmental objectives, including the reduction of greenhouse gas emissions and the expansion of renewable energy sources within the energy mix. These goals had been intended to mitigate adverse climate change effects and stabilise long-term temperature growth. However, the supply shocks triggered by Russia’s invasion of Ukraine, occurring shortly after the global disruptions caused by the COVID-19 pandemic, significantly altered the priorities of the EU. The concept of energy neutrality temporarily receded, while concerns over security of supply and geopolitical vulnerability gained renewed prominence. Recent studies highlight the need to reassess established theories linking contemporary crises with energy security, emphasising new risks and threats emerging from geopolitical instability (Basdekis et al., 2022; Katsampoxakis et al., 2022). Recent research has highlighted the growing importance of governance resilience and multilevel coordination in the EU’s energy transition, especially under crisis conditions (Labelle, 2024). This growing uncertainty has underscored the strategic importance of energy raw materials and their supply chains for political and economic decisionmakers (Jonek-Kowalska, 2022).
Energy consumption patterns and the structure of the energy mix in individual EU Member States reflect both historical supply arrangements and long-term dependencies, particularly those involving Russia (Flores Chamba et al., 2019; Nielsen et al., 2018). Differences in technological development and investment in national energy systems further shape the capacity of EU Member States to adjust to supply disruptions (Jonek-Kowalska, 2022). Research on the energy transition shows clear differences in the pace of RES deployment between Western and Central Eastern European countries, which is also confirmed by the findings of Puttachai et al. (2022). At the same time, the global network of supply and demand for mineral fuels remains complex and only partially understood, which complicates analyses of structural vulnerabilities (Dong et al., 2020). These developments are reflected in an expanding body of research examining the systemic vulnerabilities of global energy markets. Traditional international trade theories face limitations when applied to multilayered global fuel markets characterised by numerous actors and intricate interdependencies (An et al., 2014; Shirazi and Fuinhas, 2023; Wu et al., 2021; Sun et al., 2023).
Issues relating to raw material linkages in Europe are widely discussed in economic reports, statistical publications, and policy analyses. Key examples include European Energy, Annual Report 2021 (European Commission, 2021), Global Energy Review 2021 (IEA, 2021), Energy Security in the EU’s External Policy (European Parliament, 2020), European Union Energy Policy Review (IEA, 2022), and Oil and Gas Industry Outlook 2022 (Deloitte, 2022). A range of specialised online platforms also monitor market trends, macroeconomic developments, trading dynamics, and geopolitical risks. These include FitchSolutions, the EIA, and OPEC.
The question of dependencies in strategic energy markets has also been addressed extensively in academic research. For example, Nuryyev et al. (2021) examined the stability of gas supply systems, emphasising the high investment requirements and operational challenges of large scale transmission infrastructure. Their findings suggest that Russia cannot rapidly reorient gas flows from Europe to Asia due to infrastructural, financial, and temporal constraints. Lim et al. (2021) analysed global supply chain dynamics in energy markets and have argued that factors which historically supported the expansion of global value chains, such as technology transfer, capital mobility, and labour flows, now face growing geopolitical and economic pressures.
Another strand of literature focuses on how political and economic shocks reshape global energy trade. Zhou et al. (2022) have examined the evolution of international crude oil competition networks, noting that the market is subject to substantial volatility driven by pandemics, armed conflicts, and broader geopolitical tensions. Their work also highlights the growing importance of Asian and African economies, which are expected to play an increasingly central role in global oil demand. Related research addresses national level markets and demand determinants, such as Manowska et al. (2021), who explored the implications of EU climate neutrality goals for Poland’s energy strategy and future demand for natural gas and other fuels.
A particularly relevant body of literature examines the EU’s response to the energy crisis, with emphasis on diversification and resilience of supply chains. Goldthau et al. (2020) have argued that energy security in a geopolitical context depends less on autarky and more on flexibility and diversification of supply routes. Tagliapietra (2022) discussed the EU’s rapid shift towards LNG following the invasion of Ukraine, emphasising infrastructural and regulatory constraints identified in Bruegel (2022). These studies offer important insights into the challenges of transitioning away from a dominant supplier.
The literature addressing economic and political interconnections in energy raw material markets is vast and continues to expand. Additional contributions include analyses of renewable energy integration (Chebotareva et al., 2022) and the structural evolution of oil trade networks (Niu et al., 2023). Although these studies offer valuable perspectives, they also reveal a clear research gap: few works provide a comparative, quantitative and long-term analysis of the EU’s dependence on Russian mineral fuels that spans both the pre-2022 period and the transformative years following the invasion of Ukraine. The present study responds to this gap by integrating longitudinal Eurostat data with post-2022 sources in order to assess the scale, structure and evolution of EU Russia energy trade.
3. Data and methods
This study is based on quantitative data derived primarily from the Eurostat international trade database. Five time series describing the value of imports from Russia to the EU were constructed for the period 1999 to 2021 and expressed in euros on an annual basis. The analysis covers the following product groups:
- Mineral fuels, lubricants and related materials (MF);
- Coal, coke and briquettes (CC);
- Petroleum, petroleum products and related materials (PP);
- Natural and manufactured gas (GAS);
- Electric current (EL).
The objective of the analysis is to identify the scale, structure, and long-term evolution of EU imports of mineral fuels from Russia, with particular attention to variations across EU Member States and fuel categories. The period 1999 to 2021 was selected because Eurostat discontinued detailed reporting of trade flows with Russia after 2021. For the years 2022 to 2024, additional information was collected from updated Eurostat and European Commission releases, IEA reports, and specialised analytical sources, including Bruegel and the Centre for Research on Energy and Clean Air. These sources were used in a complementary manner to capture the structural adjustments that occurred after the Russian invasion of Ukraine.
The empirical strategy combines descriptive statistics, correlation analysis, and regression diagnostics. First, changes in the value and structure of imports are examined using dynamic indices and relative shares of the individual fuel categories within MF. Second, Pearson correlation coefficients are applied to assess the degree of co-movement between MF and its component categories. Third, an ordinary least squares regression model is estimated with MF as the dependent variable and CC, PP, GAS, and EL as independent variables. The model is intended to explore the internal structure of MF and the relative contribution of its components.
In order to examine the internal structure of mineral fuel imports, a dependence analysis was conducted using the Pearson correlation coefficient. In the next step, a linear regression model was constructed with MF as the dependent variable and CC, PP, GAS, and EL as independent variables:
The choice of this analytical form follows from the research objective, which involves identifying the direction and intensity of the contribution of individual fuel categories to the value of MF imports from Russia to the EU between 1999 and 2021. The model is used to assess the internal structure of MF and to explore how strongly each category co-varies with the aggregate import value.
Preliminary diagnostics indicated the presence of multicollinearity among the explanatory variables; therefore, regression results are interpreted with caution and mainly serve a structural, illustrative purpose.
In addition to aggregate EU level data, selected descriptive statistics and cluster analysis were applied to Member State level information to identify the largest importers within each fuel category and to track changes in their relative positions over time. This approach has enabled the study to account for the heterogeneity of import patterns within the EU.
Direct dependency refers to fuels physically imported from Russia under bilateral trade relations. Indirect dependency captures situations in which Russian-origin energy resources reach EU markets after processing, blending or rerouting through third countries or trading hubs. While statistically less visible, these channels may preserve structural exposure despite official diversification.
The research design supports the evaluation of the following hypotheses: H1: The structure of MF imports from Russia to the EU, in terms of type and value, remains relatively stable over time. H2: EU Member States are significantly dependent on imports of energy raw materials from Russia. H3: Russia’s military aggression in Ukraine redefined the priorities of EU energy policy. H4: Despite political declarations and sanctions, EU Member States continue to exhibit direct and indirect dependence on Russian energy imports, indicating limited effectiveness of diversification measures.
The verification of Hypothesis H4 required not only classical quantitative procedures but also qualitative assessment of policy reports and secondary sources due to the lack of complete Eurostat data after 2021. This supplementary evidence contributes to a more comprehensive understanding of the effectiveness of recent diversification efforts and the persistence of indirect import channels through third countries.
4. RESULTS AND EMPIRICAL STUDIES
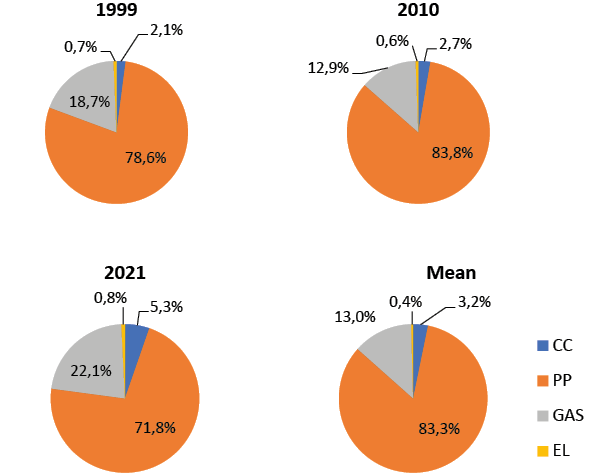
The total value of EU imports of mineral fuels, lubricants and related materials (MF) from Russia between 1999 and 2021 exceeded EUR 2 trillion, with the annual average amounting to roughly EUR 88 billion. The highest annual value, slightly above EUR 157 billion, was recorded in 2012, reflecting both elevated global energy prices and the sustained role of Russia as the EU’s dominant energy supplier. Throughout the entire period, the structure of MF imports was characterised by a clear dominance of petroleum and petroleum products (PP). Natural and manufactured gas (GAS) occupied the second-largest position, whereas coal (CC) and electric current (EL) together accounted for slightly over 3% of total MF imports (Fig. 1). This asymmetry reflects the long-term orientation of the European energy system, where oil and gas formed the strategic backbone of energy supply, pricing, and infrastructure.
Source: own work based on the Eurostat data.
4.1. Long-term growth and structural shifts in MF imports
Between 1999 and 2021, the value of MF imports increased nearly six-fold. This substantial rise was driven mainly by PP and GAS, although CC displayed the highest relative increase – almost fifteen-fold. The impressive surge in the CC index, amounting to an approximately 160% increase in its share of MF, results primarily from its very low baseline in 1999 rather than from a fundamental structural shift. By contrast, PP displayed only a slight relative decline in its share within MF, yet the absolute value of PP imports grew more than five-fold, illustrating the importance of long-term price movements on global oil markets and the stable role of PP in the energy mix (Table 1).
| 2021/1999 | MF | CC | PP | GAS | EL |
|---|---|---|---|---|---|
| Value in EUR* | 5.78 | 14.97 | 5.28 | 6.83 | 6.91 |
| Share w MF** | – | 159.02% | -8.65% | 18.18% | 19.62% |
| 2010/1999 | MF | CC | PP | GAS | EL |
| Value in EUR* | 6.62 | 8.77 | 7.06 | 4.58 | 5.96 |
| Share w MF** | – | 32.34% | 6.59% | -30.88% | -9.96% |
| 2021/2010 | MF | CC | PP | GAS | EL |
| Value in EUR* | 0.87 | 1.71 | 0.75 | 1.49 | 1.16 |
| Share w MF** | – | 95.72% | -14.29% | 70.98% | 32.85% |
* Index, ** Relative increase
Source: own work based on Eurostat data.
PP remained the structural anchor of MF despite its modest decline in relative share. GAS strengthened its position after 2010, reflecting the EU’s shift toward gas-fired power generation, while CC, although volatile, experienced temporary surges connected with both market and regulatory changes. EL maintained a marginal role throughout the period.
4.2. Country-level concentration of MF imports
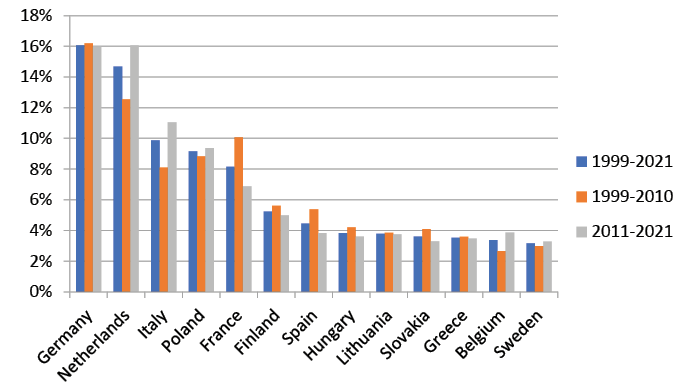
Cluster analysis confirms a high geographical concentration of MF imports. More than 90% of EU imports of MF from Russia between 1999 and 2021 were directed to only thirteen EU Member States, with Germany, the Netherlands, Italy, Poland, and France together accounting for over half. Germany was the largest importer over the two-decade period; however, in the most recent decade, the Netherlands overtook Germany, reflecting its hub function (Fig. 2).
Source: own work based on the Eurostat data.
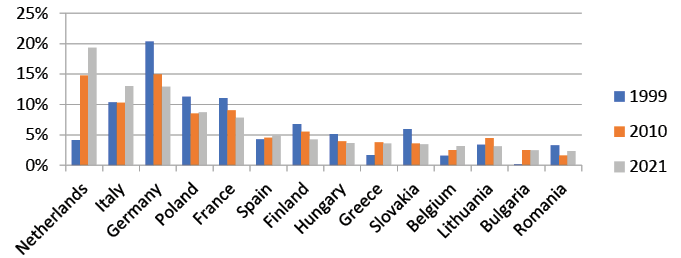
By 2021, the Netherlands became the leading importer of MF, followed by Italy and Germany. Relative to 1999, the Dutch share of total EU MF imports increased nearly five-fold. Germany, by contrast, reduced its share by approximately 36%, partly due to diversification measures adopted after 2014 and changes in the configuration of European supply chains (Fig. 3).
Source: own work based on the Eurostat data.
4.3. Category-specific analysis: CC, PP, GAS and EL
4.3.1. Coal, coke and briquettes (CC)
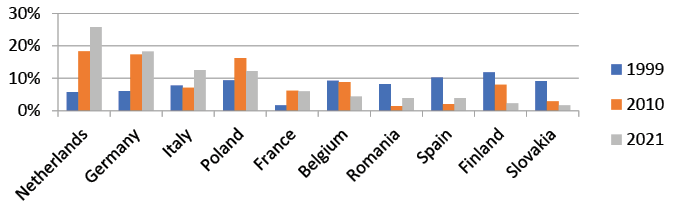
The Netherlands was the largest importer of CC in 2021, having increased its share of EU CC imports by nearly 350% compared to 1999. Germany, positioned second, recorded an increase of roughly 20%, while Italy – third in rank – expanded its share by around 61% (Fig. 4).
Source: own work based on the Eurostat data.
The strong rise in Dutch CC imports reflects its hub function. Germany’s limited growth corresponds with its gradual coal phase-out policy, while Italy’s moderate increase reflects industrial demand patterns.
4.3.2. Petroleum and petroleum products (PP)
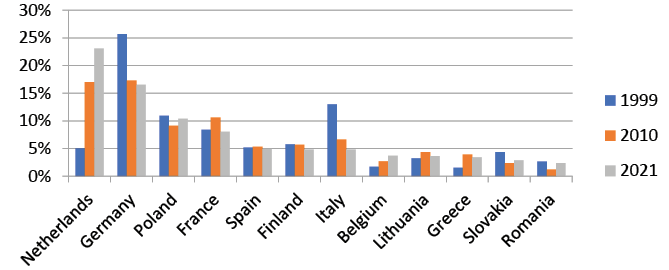
The Netherlands was also the largest importer of PP in 2021, with its share rising by almost 360% compared with 1999. Germany, ranked second, reduced its share by 36% over the period, reflecting long-term diversification. Poland, also classified in the second/top group in 2021, recorded a slight decline of around 5% (Fig. 5).
Source: own work based on the Eurostat data.
PP trade reflects both consumption patterns and the growing importance of EU refining and distribution hubs. The Netherlands dominates, reflecting its hub function within European distribution networks.
4.3.3. Natural and manufactured gas (GAS)
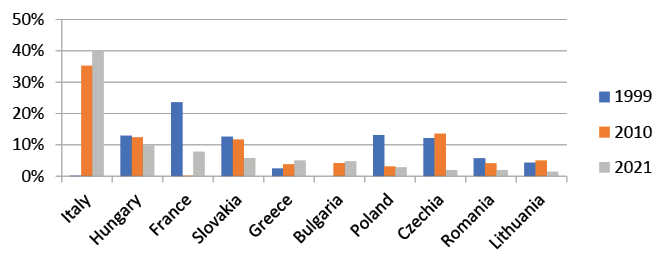
Italy was the largest importer of GAS, followed by Hungary and France. Relative analysis is not feasible due to the presence of zero values in certain years, which distort percentage comparisons (Fig. 6).
Italy’s strong dependence on Russian gas reflects both pipeline geography and long-standing contractual arrangements. Hungary’s high exposure is shaped by limited diversification options in Central Europe, while France’s position is influenced by LNG infrastructure and mixed sourcing strategies.
A crucial development occurred after 2021. Russia’s share in the EU gas supplies dropped to 12–13% by 2024 (European Commission, 2024). This reflects a structural realignment driven by LNG imports and increased pipeline deliveries from Norway, the United States, and Qatar.
Source: own work based on the Eurostat data.
4.3.4. Electric current (EL)
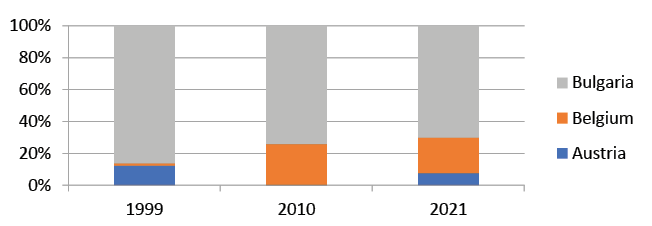
Russia supplied EL almost exclusively to three EU Member States: Bulgaria, Belgium, and Austria. Their combined share in total EL imports exceeded 99.7% in 1999–2021, with Bulgaria being the clear leader in this narrow category (Fig. 7).
Source: own work based on the Eurostat data.
4.4. Import patterns in 2022–2024
The value of EU energy imports in 2024 reached EUR 375.9 billion (16.2% less than in 2023). Imports from Russia decreased to EUR 35.9 billion, with mineral fuels constituting approximately 62% (~EUR 22.3 billion). The share of Russian gas fell to 12–13%, signalling a shift toward LNG and intensified imports from Norway, the USA, Qatar, and Azerbaijan (IEA 2024).
These results confirm that the structural dependency observed in 1999–2021 was dramatically reshaped after 2022. However, the degree of diversification varies significantly across EU Member States, and indirect imports through third countries remain analytically relevant.
To understand how these post-2022 structural changes relate to the historical dynamics of MF imports, the next section examines the internal co-movement between individual fuel categories.
4.5. Correlation analysis and internal co-movement of MF components
To better understand the internal structure of mineral fuel imports, Pearson correlation coefficients were calculated between MF and its four component categories (CC, PP, GAS, and EL). The results reveal exceptionally strong positive correlations, particularly between MF and PP, and between MF and GAS. As shown in Table 2, PP exhibits the strongest correlation with MF (0.995), followed by GAS (0.833). These two categories dominate MF both in terms of value and volatility, which explains the near-perfect synchronisation of their long-term trends already visible in the relative dynamics presented in Table 1.
The strength of these correlations indicates that changes in MF are primarily driven by fluctuations in PP and GAS imports. This sensitivity aligns with the characteristics of EU-Russia energy relations, where oil and gas prices jointly respond to global commodity cycles, geopolitical tensions and supply disruptions. Coal (CC), despite its marginal contribution to MF (as shown in Table 1, low share but high proportional index), also displays a strong correlation with MF (0.700), mainly due to price-driven volatility during crisis years. Electric current (EL), despite showing a statistically significant correlation, remains structurally negligible due to its extremely small share in MF imports (Table 2).
| Pearson Correlation (Sig.) | MF | CC | PP | GAS |
|---|---|---|---|---|
| CC | 0.700**(0.000) | – | – | – |
| PP | 0.995**(0.000) | 0.646**(0.001) | – | – |
| GAS | 0.833**(0.000) | 0.773**(0.000) | 0.778**(0.000) | – |
| EL | 0.628**(0.001) | 0.683**(0.000) | 0.579**(0.004) | 0.733**(0.000) |
** Correlation is significant at the 0.01 level (2-tailed)
Source: own work based on Eurostat data.
The correlation structure demonstrates that PP and GAS constitute the backbone of the EU’s long-term dependence on Russian mineral fuels. Their strong co-movement foreshadows the multicollinearity patterns observed in subsequent regression analysis. This is consistent with structural characteristics of the European energy system, where oil and gas markets respond simultaneously to external shocks and exhibit highly synchronised price cycles. The proportional changes shown in Table 1 confirm that PP and GAS overwhelmingly determine the behaviour of MF over time.
4.6. Regression analysis and structural interpretation
Because MF is arithmetically constructed as the sum of its components, regression cannot be interpreted in a causal or predictive sense. Instead, it serves as a diagnostic device demonstrating the mechanical dominance of PP and GAS within the aggregate.
Based on the correlation patterns described above, a regression analysis was conducted to assess how the four fuel categories collectively explain variation in MF imports. The initial model exhibited very high explanatory power (R² = 1.000), which is mechanically expected given the accounting identity between MF and its components, indicating that the independent variables closely mirrored the movement of MF.
| Model fit | Analysis of variance | Durbin- Watson | |||||
|---|---|---|---|---|---|---|---|
| R Square | Std. error | F | df1 | df2 | Sig.* | R Square | |
| 1.000 | 567,043,173 | 164,800 | 4 | 19 | <0.001 | 1.417 | 1.000 |
* Acceptable level: Sig. <0.05
Source: own work based on Eurostat data.
To assess whether the very high explanatory power of the model resulted from structural properties of the dataset, diagnostic testing was performed, the results of which are summarised in Table 4.
| Variable | Unstandardised Coefficients | t | Sig. | Collinearity Statistics | ||
|---|---|---|---|---|---|---|
| βn, n=1,…,4 | Std. error | Tolerance | VIF | |||
| CC | 0.938 | 0.125 | 7.526 | 0.000 | 0.086 | 11.564 |
| PP | 1.012 | 0.005 | 186.458 | 0.000 | 0.073 | 13.619 |
| GAS | 0.899 | 0.048 | 18.828 | 0.000 | 0.040 | 25.212 |
| EL | 2.647 | 0.928 | 2.853 | 0.000 | 0.096 | 10.419 |
* Acceptable level: Sig. <0.05; Dependent Variable: MF; VIF - Variance Inflation Factor
Source: own work based on Eurostat data.
To address this, a second model was estimated with GAS removed. As indicated in Table 5, the overall explanatory power of the model (R² = 1.000) remains high, yet the sharp increase in the standard error and the substantial decrease in the F-statistic indicate a loss of model precision after removing GAS.
| Model fit | Analysis of variance | Durbin- Watson | |||||
|---|---|---|---|---|---|---|---|
| R Square | Std. error | F | df1 | df2 | Sig.* | R Square | |
| 1.000 | 2,450,476,908 | 11,759 | 3 | 19 | <0.001 | 1.127 | 1.000 |
* Acceptable level: Sig. <0.05
Source: own work based on Eurostat data.
In the reduced model, the number of predictors decreases to three (CC, PP, EL), which is reflected in the adjusted degrees of freedom. Although the reduced model formally retains an R² of 1.000, the sharp increase in the standard error and the dramatic drop in the F-statistic indicate a substantial loss of explanatory precision. This confirms that GAS captures unique structural variance within MF and cannot be reliably excluded.
Table 6 shows that VIF values declined to the range of 8–9, which, although still high, indicates improved stability of coefficient estimates.
| Variable | Unstandardised Coefficients | t | Sig. | Collinearity Statistics | ||
|---|---|---|---|---|---|---|
| βn, n=1,…,3 | Std. error | Tolerance | VIF | |||
| CC | 1.890 | 0.492 | 3.842 | 0.001 | 0.104 | 9.656 |
| PP | 1.076 | 0.018 | 58.791 | 0.000 | 0.121 | 8.291 |
| EL | 10.005 | 3.636 | 2.751 | 0.012 | 0.117 | 8.570 |
* Acceptable level: Sig. <0.05; Dependent Variable: MF; VIF - Variance Inflation Factor
Source: own work based on Eurostat data.
The coefficients in Table 6 correspond to the reduced model that includes only three predictors (CC, PP, EL), following the exclusion of GAS.
Because PP dominates MF imports (Table 1), and because the exclusion of GAS significantly reduces model precision as shown in Table 5, the influence of PP overwhelms the remaining components, making it statistically difficult to isolate the independent effects of CC and EL. The Durbin–Watson statistic (1.417, Tables 3 and 5) indicates no clear autocorrelation, suggesting that the primary issue is structural interdependence rather than model mis-specification.
It is important to emphasise that the regression model has a deterministic character, as the aggregate MF variable is by definition the sum of its four components (CC, PP, GAS, and EL). This mathematical identity guarantees a perfect fit (R² = 1.000) in the absence of measurement error, regardless of the underlying statistical relationships. The purpose of the regression analysis in this study is, therefore, not predictive; rather, it is used as a diagnostic tool to reveal the extent of multicollinearity among the MF components and to illustrate their structural interdependence within the EU-Russia energy trade system. Given the accounting identity between variables, latent-factor approaches would not substantially increase explanatory insight. The aim is structural illustration rather than dimensional reduction.
Because MF is arithmetically defined as the sum of its components, the regression inevitably exhibits a deterministic character. The very high R² therefore reflects the accounting structure of the variables rather than statistical explanatory strength. In this context, the model should be interpreted as an illustration of internal proportionality within MF.
Given the accounting identity between variables, latent-factor approaches would not substantially increase explanatory insight. The objective is not dimensional reduction but a transparent presentation of how strongly the aggregate is mechanically driven by its dominant components. Consequently, the regression results complement the correlation evidence (Table 2) and the long-term dynamics presented earlier (Table 1), while detailed parameter interpretation should be treated with caution.
4.7. Structural differentiation among EU Member States
While aggregate MF values show strong long-term dependence on Russia, country-level patterns reveal considerable asymmetry across the EU. Cluster analysis grouped EU Member States based on the scale and structure of their MF imports. More than 90% of total MF imports were concentrated in thirteen EU Member States, with Germany, the Netherlands, and Italy forming the core group, followed by Poland and France.
The role of the Netherlands increased significantly, especially after 2010. This reflects, as discussed earlier, the strategic position of Rotterdam as the EU’s largest seaborne energy hub, handling crude oil, refined products and LNG. Italy’s position strengthened particularly in GAS imports, supported by long-term pipeline connections and diversified import terminals. Germany, once the dominant importer, reduced its relative share due to diversification efforts initiated after 2014 and strengthened after 2021.
Central and Eastern European (CEE) EU Member States displayed notable dependence in CC and GAS imports. Hungary’s and Slovakia’s high exposure resulted from limited diversification pathways, while Poland’s role was shaped primarily by PP imports and refinery operations.
4.8. Post-2022 structural transformation
The post-2022 period marks a profound shift in the EU-Russia energy relations. Although Eurostat no longer publishes full bilateral trade data after 2021, aggregated data show that the collapse of Russian pipeline gas flows was only partially offset by LNG and alternative pipeline imports. By 2024, Russia’s share in EU gas demand fell to 12–13%. LNG imports from the United States and Qatar increased sharply, while Norway consolidated its position as the EU’s largest pipeline supplier.
Despite reduced volumes, the EU still imported approximately EUR 22.3 billion in mineral fuels from Russia in 2024, representing around 62% of total remaining EU-Russia trade. Adjustment speed varied across EU Member States due to differences in infrastructure capacity, regasification terminals, long-term contracts and domestic energy strategies.
Recent evidence suggests that some Member States continue to import significant volumes of Russian liquefied natural gas. According to IEEFA-based reporting, Belgium’s Zeebrugge terminal was the largest entry point for Russian LNG into the EU in 2024 (The Brussels Times, 2025; WNP, 2025). Meanwhile, in the 2023–2024 period, France increased its Russian LNG imports by 81%, with deliveries costing approximately EUR 2.68 billion (Kalus, 2025). These data underline that, despite EU-wide efforts to diversify energy sources and reduce pipeline dependence on Russia, structural and infrastructural ties continue to bind some member states to Russian supply – complicating the narrative of a uniform decoupling across the EU.
Despite the EU’s declared objective of phasing out Russian gas imports by 2027, the implementation of this policy remains politically fragmented among Member States. Several Central and Eastern European countries, including Hungary and Slovakia, have openly questioned the feasibility of a full embargo, arguing that existing long-term contracts, infrastructural limitations and national energy security considerations prevent an immediate cessation of Russian supplies. Such positions illustrate that formal EU-level decisions do not automatically translate into uniform implementation across the EU, and that the process of disentangling from Russian energy remains subject to legal and political contestation. This highlights that achieving meaningful decoupling requires not only technical diversification but also institutional coordination and a shared approach to the distribution of transition costs (Gadawa, 2025).
The findings indicate a major structural reconfiguration of the EU’s energy system. However, the long-term patterns recorded in Table 1 remain essential for understanding why the decoupling process has been uneven. Member State-level disparities and indirect import channels through intermediaries or third countries demonstrate that EU dependence has decreased but not been fully eliminated. These results highlight both long-term progress and persistent vulnerabilities within the European energy architecture. These structural developments provide the empirical basis for the verification of the research hypotheses presented in the methodological section, particularly those related to dependence and diversification patterns.
5. Discussion
The empirical findings presented in this study make it possible to evaluate the four research hypotheses and situate the results within the broader academic debate on EU energy security. The empirical findings presented in this study make it possible to evaluate the four research hypotheses and situate the results within the broader academic debate. The hypotheses serve as analytical guidelines rather than strict econometric propositions. The first hypothesis (H1), which assumed that the structure of MF imports from Russia would remain relatively stable over time, cannot be fully confirmed. Although PP and GAS consistently dominated the import basket, the shifts observed among EU Member States – particularly the rising importance of the Netherlands and Italy and the relative decline of Germany – demonstrate that the system was more dynamic than initially assumed. The post-2022 transformation, marked by the collapse of Russian pipeline gas and the rapid expansion of LNG imports, further underscores this structural evolution (European Commission, 2024; IEA, 2023). The case of the Netherlands illustrates the distinction between transit dependency and domestic energy strategy. A large proportion of Russian fuels registered in Dutch statistics is linked to the logistical and refining functions of Rotterdam as a European hub, rather than to final national consumption. In terms of national policy, the Netherlands simultaneously pursues ambitious offshore wind expansion and decarbonisation targets. This asymmetry implies that trade statistics may exaggerate national exposure while underestimating the regional economic relevance of port and logistics activities. Such a mismatch may generate future debates on compensation mechanisms within EU solidarity frameworks.
The second hypothesis (H2), positing that EU Member States were significantly dependent on Russian mineral fuels, is strongly supported by the evidence. Russian MF formed the backbone of EU-Russia trade relations between 1999 and 2021, shaping energy security policy and reinforcing long-term infrastructural dependencies (Flores-Chamba et al., 2019; Nielsen et al., 2018). This dependence was uneven across the EU, being particularly pronounced in Germany, Italy, Hungary, Slovakia, and several CEE states.
The third hypothesis (H3), which anticipated that Russia’s invasion of Ukraine would redefine EU energy policy priorities, is strongly supported by the observed developments. Numerous authors emphasise that crises reorganise policy hierarchies and shift attention away from environmental objectives toward security and resilience (Basdekis et al., 2022; Katsampoxakis et al., 2022). After 2022, diversification accelerated, mainly through LNG and alternative pipeline suppliers (Jonek-Kowalska, 2022; Goldthau and Sitter, 2020).
The fourth hypothesis (H4), suggesting that EU dependence on Russian energy would persist directly or indirectly despite political declarations and sanctions, receives partial empirical support. Direct imports declined sharply, yet the EU still paid around EUR 21.9 billion for Russian fossil fuels in 2024 (CREA, 2025). Indirect imports via third countries such as India and China grew significantly, illustrating the difficulty of fully severing trade ties in globalised markets (CREA, 2025; Trade Map, 2025). This confirms that decoupling is uneven, limited and structurally constrained.
These findings align with existing literature that highlights the complexity of global energy supply chains, the limitations of traditional trade theory in analysing strategic commodity flows, and the growing influence of geopolitical shocks on energy markets (An et al., 2014; Shirazi and Fuinhas, 2023; Wu et al., 2021; Sun et al., 2023). They also reinforce evidence on path dependence in infrastructure-based energy systems (Nuryyev et al., 2021; Lim et al., 2021). The strong co-movement of MF components (Table 2) supports the argument that structural interdependencies shape both market behaviour and policy responses (Goldthau and Sitter, 2020).
The study faces several limitations. The discontinuation of detailed Eurostat reporting after 2021 restricts the comparability of post-2022 data. The main limitation results from the structural nature of the dataset, in which aggregate indicators are mechanically linked to their components. This reduces the scope for advanced econometric interpretation and shifts the emphasis toward structural and descriptive insight. In addition, indirect trade flows remain partly invisible in official statistics, which complicates precise measurement of the true scale of continued exposure.
Future research should aim to incorporate more complete post-2022 data to assess the permanence of observed structural shifts. It will be essential to deepen the analysis of indirect trade flows by combining customs, maritime and third-country trade data to capture rerouted Russian exports. Additionally, country-level case studies – particularly for Germany, Italy, the Netherlands, and CEE states – could offer valuable insights into the heterogeneous strategies and adaptation capacities that shape the evolving European energy landscape.
6. Conclusions
The analysis presented in this study makes it possible to identify several important conclusions regarding the nature and evolution of the European Union’s energy dependence on Russia between 1999 and 2024. The findings show that Russian energy raw materials formed a central element of the EU’s import structure for more than two decades and influenced trade patterns, infrastructure development, and strategic decision-making within the EU. Although petroleum products and natural gas consistently dominated mineral fuel imports, the structure was not entirely stable. Changes occurred both in the composition of imported fuel types and in the distribution of imports among EU Member States, with the Netherlands and Italy becoming increasingly important and Germany’s share gradually declining.
The developments after 2022 marked a decisive shift. Russia’s invasion of Ukraine disrupted long-established supply routes and exposed the risks associated with concentrated import dependencies. Diversification progressed rapidly, although unevenly across Member States. Despite this progress, the process of reducing dependence remains incomplete. Differences in national energy systems, the persistence of long-term contractual arrangements and the increasing role of indirect imports through third countries illustrate how deeply historical dependencies continue to shape today’s energy relations.
Overall, the results indicate that the EU’s energy security is closely linked to the flexibility of supply options, the resilience of infrastructure and the EU’s capacity to adapt to geopolitical shocks. They also indicate the need for policies that better account for regional differences, particularly in the EU Member States that have traditionally been more exposed to supply risks, including those in Central and Eastern Europe. Strengthening solidarity mechanisms, improving coordination and supporting strategic investments will be essential for achieving a more balanced and resilient energy system.
From a research perspective, the study highlights the importance of continued monitoring of energy trade flows in a rapidly changing geopolitical environment. Future work should focus on improving methods for identifying indirect imports, analysing the long-term implications of the EU’s energy transition for external dependency and examining the different adjustment strategies pursued by individual the EU Member States. As the EU continues to reshape its energy system and moves toward climate neutrality, understanding these processes will be essential for ensuring economic stability and strategic security.
Autorzy
REFERENCES
AH-VOUN, D., CHYONG, C. K. and LI, C. (2024), ‘Europe’s energy security: From Russian dependence to renewable reliance’, Energy Policy, 184, 113856. https://doi.org/10.1016/j.enpol.2023.113856
AN, H., ZHONG, W., CHEN, Y., LI, H. and GAO, X. (2014), ‘Features and evolution of international crude oil trade relationships: A trading-based network analysis’, Energy, 74, pp. 254–259. https://doi.org/10.1016/j.energy.2014.06.095
BANKIER.PL (2023), ‘Jedynie siedem krajów UE zmniejszyło import z Rosji’, https://www.bankier.pl/wiadomosc/Media-jedynie-siedem-krajow-UE-zmniejszylo-import-z-Rosji-8468680.html [accessed on: 15.02.2025].
BASDEKIS, C., CHRISTOPOULOS, A., KATSAMPOXAKIS, I. and NASTAS, V. (2022), ‘The Impact of the Ukrainian War on Stock and Energy Markets: A Wavelet Coherence Analysis’, Energies, 15 (21), 8174. https://doi.org/10.3390/en15218174
BRUEGEL (2022), ‘REPowerEU: Will EU countries really make it work?’, https://www.bruegel.org/blog-post/repowereu-will-eu-countries-really-make-it-work [accessed on: 18.09.2025].
BRUEGEL (2024), ‘Future European Union gas imports: Balancing different objectives’, https://www.bruegel.org/analysis/future-european-union-gas-imports-balancing-different-objectives [accessed on: 16.09.2025].
CREA (2025), ‘EU imports of Russian fossil fuels in third year of invasion surpass financial aid sent to Ukraine’, https://energyandcleanair.org/publication/eu-imports-of-russian-fossil-fuels-in-third-year-of-invasion-surpass-financial-aid-sent-to-ukraine/ [accessed on: 24.10.2025].
CHEBOTAREVA, G., TVARONAVIČIENĖ, M., GORINA, L., STRIELKOWSKI, W., SHIRYAEVA, J. and PETRENKO, Y. (2022), ‘Revealing Renewable Energy Perspectives via the Analysis of the Wholesale Electricity Market’, Energies, 15 (3), 838. https://doi.org/10.3390/en15030838
CZECH, K. and WIELECHOWSKI, M. (2023), ‘Russian aggression against Ukraine and the changes in European Union countries’ macroeconomic situation: Do energy intensity and energy dependence matter?’, Economics and Business Review, 9 (4). https://doi.org/10.18559/ebr.2023.4.1073
DELOITTE (2022), ‘2022 Oil and Gas Industry Outlook, Deloitte Insights’, https://www2.deloitte.com [accessed on: 13.08.2023].
DONG, G., QING, T., DU, R., WANG, C., LI, R., WANG, M., TIAN, L., CHEN, L., VILELA, A. L. M. and STANLEY, H. E. (2020)., ‘Complex network approach for the structural optimization of global crude oil trade system’, Journal of Cleaner Production, 251, 119366. https://doi.org/10.1016/j.jclepro.2019.119366
EUROPEAN COMMISSION (2019), ‘The European Green Deal, Communication from the Commission to the European Parliament, the European Council, the Council, the European Economic and Social Committee and the Committee of the Regions’, Brussels, https://eur-lex.europa.eu/legal-content/EN/TXT/?uri=CELEX:52019DC0640 [accessed on: 01.02.2026].
EUROPEAN COMMISSION (2021), ‘European Energy: Annual Report 2021, Directorate-General for Energy’, Brussels, https://energy.ec.europa.eu [accessed on: 13.08.2023].
EUROPEAN COMMISSION (2022), ‘REPowerEU Plan, Communication from the Commission to the European Parliament, the European Council, the Council, the European Economic and Social Committee and the Committee of the Regions’, Brussels, https://eur-lex.europa.eu/legal-content/EN/TXT/?uri=CELEX:52022DC0230 [accessed on: 01.02.2026].
EUROPEAN COMMISSION (2024), ‘EU trade relations with Russia. Facts, figures and latest developments’, https://policy.trade.ec.europa.eu/eu-trade-relationships-country-and-region/countries-and-regions/russia_en [accessed on: 27.11.2024].
EUROPEAN PARLIAMENT (2020), ‘Energy Security in the EU’s External Policy, European Parliamentary Research Service’, Brussels, https://www.europarl.europa.eu/thinktank [accessed on: 13.08.2023].
EUROSTAT (2023), ‘EU energy mix and import dependency’, https://ec.europa.eu/eurostat/statistics-explained/index.php?title=EU_energy_mix_and_import_dependency#EU_energy_dependency_on_Russia [accessed on: 27.11.2024].
EUROSTAT (2025), ‘Imports of energy products to the EU down in 2024’, https://ec.europa.eu/eurostat/web/products-eurostat-news/w/ddn-20250321-1 [accessed on 21.03.2025].
FINLEY, M. and MIKULSKA, A. (2023), Wielding the Energy Weapon: Differences Between Oil and Natural Gas. https://doi.org/10.25613/G9P2-3F78
FLORES-CHAMBA, J., LÓPEZ-SÁNCHEZ, M., PONCE, P., GUERRERO-RIOFRÍO, P. and ÁLVAREZ-GARCÍA, J. (2019), ‘Economic and Spatial Determinants of Energy Consumption in the European Union’, Energies, 12 (21), 4118. https://doi.org/10.3390/en12214118
GADAWA, M. (2025), ‘Historyczna decyzja ws. Rosyjskiego gazu. Węgry oburzone. Reagują’, Money.pl – portal finansowy, https://www.money.pl/gospodarka/ue-konczy-z-rosyjskim-gazem-wegry-i-slowacja-juz-odpowiadaja-7228474176781248a.html [accessed on: 04.12.2025].
GOLDTHAU, A. C. and YOUNGS, R. (2023), ‘The EU Energy Crisis and a New Geopolitics of Climate Transition’, JCMS: Journal of Common Market Studies, 61 (S1), pp. 115–124. https://doi.org/10.1111/jcms.13539
GOLDTHAU, A., EICKE, L. and WEKO, S. (2020), ‘The Global Energy Transition and the Global South’, [in:] HAFNER, W. M. and TAGLIAPIETRA, S. (eds), The Geopolitics of the Global Energy Transition, 73, pp. 319–339. Springer International Publishing. https://doi.org/10.1007/978-3-030-39066-2_14
GOLDTHAU, A. and SITTER, N. (2020), ‘Power, authority and security: The EU’s Russian gas dilemma’, Journal of European Integration, 42 (1), pp. 111–127. https://doi.org/10.1080/07036337.2019.1708341
IEA (2021), Global Energy Review 2021, International Energy Agency, Paris, https://iea.blob.core.windows.net/assets/d0031107-401d-4a2f-a48b-9eed19457335/GlobalEnergyReview2021.pdf [accessed on: 15.07.2023].
IEA (2022), European Union Energy Policy Review, International Energy Agency, Paris, https://www.oecd.org/en/publications/iea-energy-policy-reviews_8550daed-en.html [accessed on: 15.07.2023].
IEA (2023), World Energy Outlook 2023 – Analysis, https://www.iea.org/reports/world-energy-outlook-2023 [accessed on: 17.05.2024].
IEA (2024), Share of European Union gas demand met by Russian supply, 2001-2024 – Charts – Data and Statistics, https://www.iea.org/data-and-statistics/charts/share-of-european-union-gas-demand-met-by-russian-supply-2001-2024 [accessed on: 17.09.2025].
JONEK-KOWALSKA, I. (2022), ‘Multi-criteria evaluation of the effectiveness of energy policy in Central and Eastern European countries in a long-term perspective’, Energy Strategy Reviews, 44, 100973. https://doi.org/10.1016/j.esr.2022.100973
KALUS, K. (2025), ‘LNG z Rosji. Głównym odbiorcą w Europie jest Francja’, Money.pl – portal finansowy, https://www.money.pl/gospodarka/lng-z-rosji-glownym-odbiorca-w-europie-jest-francja-7126476393933632a.html [accessed on: 04.12.2025].
KATSAMPOXAKIS, I., CHRISTOPOULOS, A., KALANTONIS, P. and NASTAS, V. (2022), ‘Crude Oil Price Shocks and European Stock Markets during the COVID-19 Period’, Energies, 15 (11), 4090. https://doi.org/10.3390/en15114090
LABELLE, M. C. (2024), ‘Breaking the era of energy interdependence in Europe: A multidimensional reframing of energy security, sovereignty, and solidarity’, Energy Strategy Reviews, 52, 101314. https://doi.org/10.1016/j.esr.2024.101314
LIM, B., YOO, J., HONG, K. and CHEONG, I. (2021), ‘Impacts of Reverse Global Value Chain (GVC) Factors on Global Trade and Energy Market’, Energies, 14 (12), 3417. https://doi.org/10.3390/en14123417
MANOWSKA, A., RYBAK, A., DYLONG, A. and PIELOT, J. (2021), ‘Forecasting of Natural Gas Consumption in Poland Based on ARIMA-LSTM Hybrid Model’, Energies, 14 (24), 8597. https://doi.org/10.3390/en14248597
MATA PÉREZ, M. D. L. E., SCHOLTEN, D. and SMITH STEGEN, K. (2019), ‘The multi-speed energy transition in Europe: Opportunities and challenges for EU energy security’, Energy Strategy Reviews, 26, 100415. https://doi.org/10.1016/j.esr.2019.100415
NIELSEN, H., WARDE, P. and KANDER, A. (2018), ‘East versus West: Energy intensity in coal-rich Europe, 1800–2000’, Energy Policy, 122, pp. 75–83. https://doi.org/10.1016/j.enpol.2018.07.006
NIU, X., CHEN, W. and WANG, N. (2023), ‘Spatiotemporal Dynamics and Topological Evolution of the Global Crude Oil Trade Network’, Energies, 16 (4), 1728. https://doi.org/10.3390/en16041728
NURYYEV, G., KOROL, T. and TETIN, I. (2021), ‘Hold-Up Problems in International Gas Trade: A Case Study’, Energies, 14 (16), 4984. https://doi.org/10.3390/en14164984
PUTTACHAI, W., PHADKANTHA, R. and YAMAKA, W. (2022), ‘The threshold effects of ESG performance on the energy transitions: A country-level data’, Energy Reports, 8, pp. 234–241. https://doi.org/10.1016/j.egyr.2022.10.187
RYBAK, A., RYBAK, A. and KOLEV, S. D. (2022), ‘The import of energy raw materials and the energy security of the European Union – the case of Poland’, Gospodarka Surowcami Mineralnymi – Mineral Resources Management, pp. 29–48. https://doi.org/10.24425/gsm.2022.143630
SAMPEDRO, J., VAN DE VEN, D.-J., HOROWITZ, R., RODÉS-BACHS, C., FRILINGOU, N., NIKAS, A., BINSTED, M., IYER, G. and YARLAGADDA, B. (2024), ‘Energy system analysis of cutting off Russian gas supply to the European Union’, Energy Strategy Reviews, 54, 101450. https://doi.org/10.1016/j.esr.2024.101450
SHIRAZI, M. and FUINHAS, J. A. (2023), ‘Portfolio decisions of primary energy sources and economic complexity: The world’s large energy user evidence’, Renewable Energy, 202, pp. 347–361. https://doi.org/10.1016/j.renene.2022.11.050
SPIRO, D., WACHTMEISTER, H. and GARS, J. (2025), ‘Assessing the impacts of oil sanctions on Russia’, Energy Policy, 206, 114739. https://doi.org/10.1016/j.enpol.2025.114739
SUN, X., WEI, Y., JIN, Y., SONG, W. and LI, X. (2023), ‘The evolution of structural resilience of global oil and gas resources trade network’, Global Networks, 23 (2), pp. 391–411. https://doi.org/10.1111/glob.12399
THE BRUSSELS TIMES (2025), ‘Zeebrugge is the top destination for Russian LNG in Europe’, https://www.brusselstimes.com/1449926/zeebrugge-main-destination-for-russian-lng-in-europe?utm= [accessed on: 04.12.2025].
TRADE MAP (2025), Trade statistics for international business development, https://www.trademap.org/Index.aspx [accessed on: 17.09.2025].
WEINER, C., KOTEK, P. and TAKÁCSNÉ TÓTH, B. (2025), ‘Two decades of changing dependency on Russian gas in Central and Eastern Europe: Strategies versus achievements’, Journal of Contemporary European Studies, 33 (2), pp. 324–343. https://doi.org/10.1080/14782804.2024.2385978
WNP (2025), ‘Belgijski port jest bramą dla rosyjskiego LNG’, https://www.wnp.pl/energia/belgijski-port-jest-brama-dla-rosyjskiego-lng,995731.html [accessed on: 04.12.2025].
WU, G., PU, Y. and SHU, T. (2021), ‘Features and evolution of global energy trade network based on domestic value-added decomposition of export’, Energy, 228, 120486. https://doi.org/10.1016/j.energy.2021.120486
ZHOU, X., ZHANG, H., ZHENG, S., XING, W., ZHAO, P. and LI, H. (2022), ‘The Crude Oil International Trade Competition Networks: Evolution Trends and Estimating Potential Competition Links’, Energies, 15 (7), 2395. https://doi.org/10.3390/en15072395